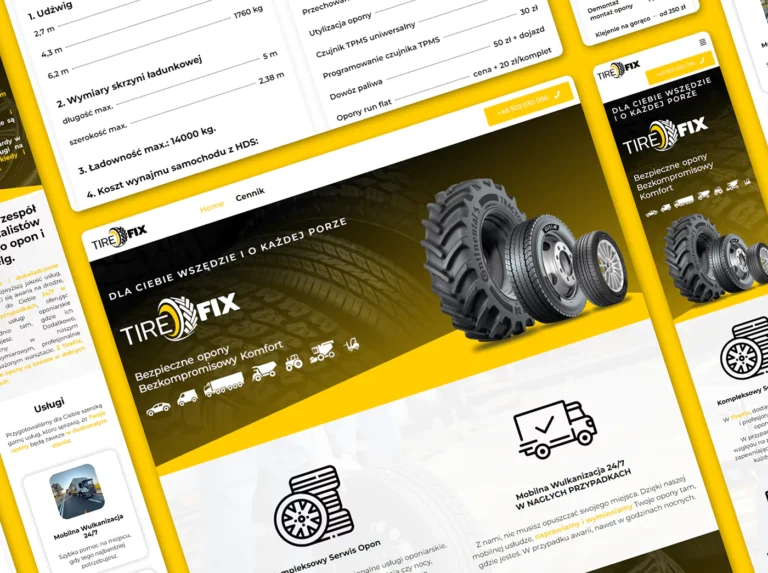
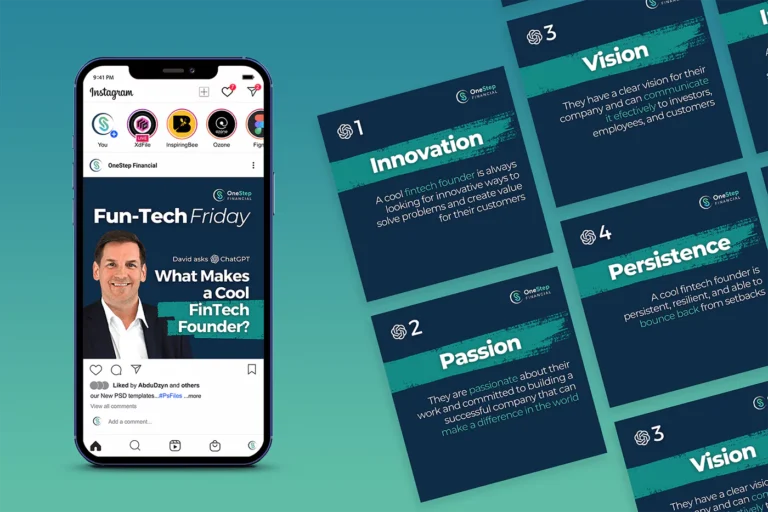
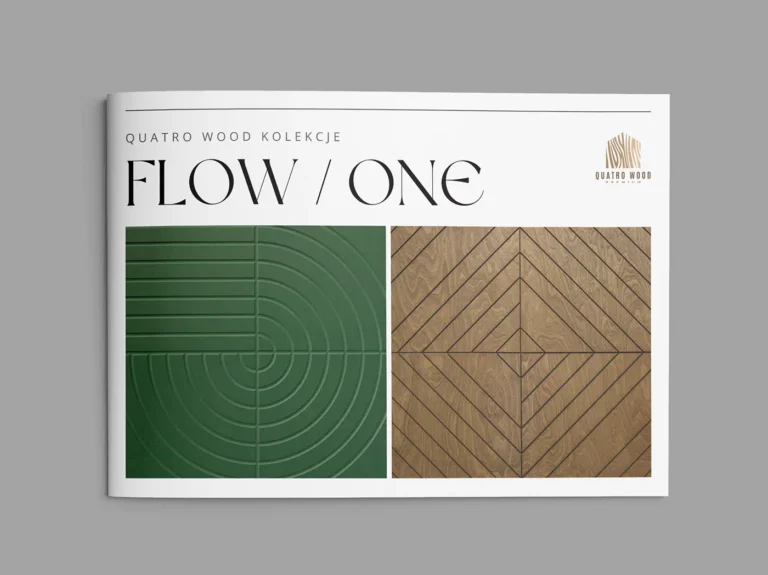
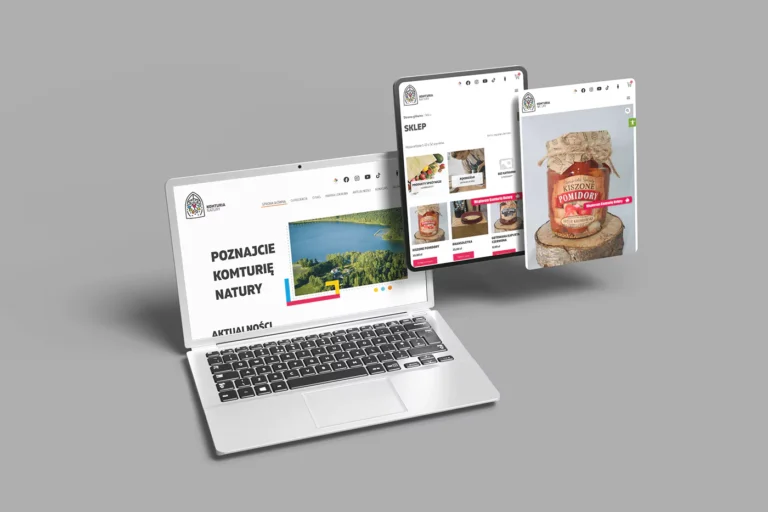
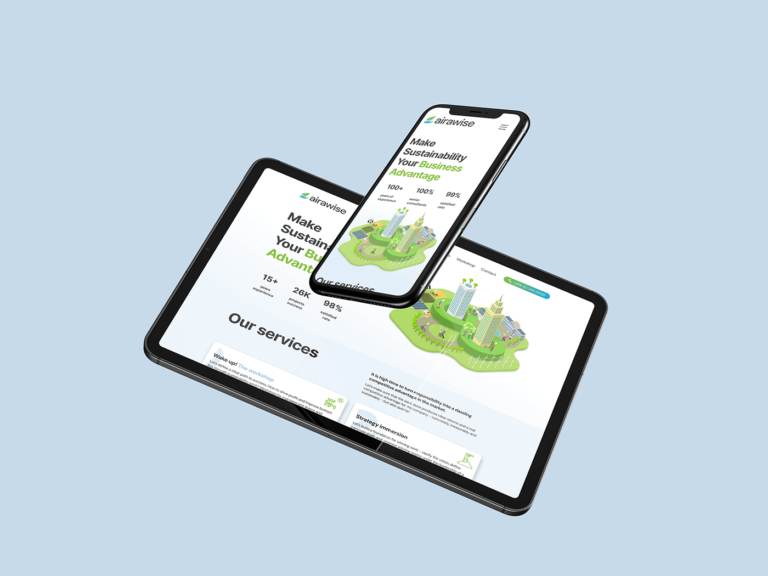
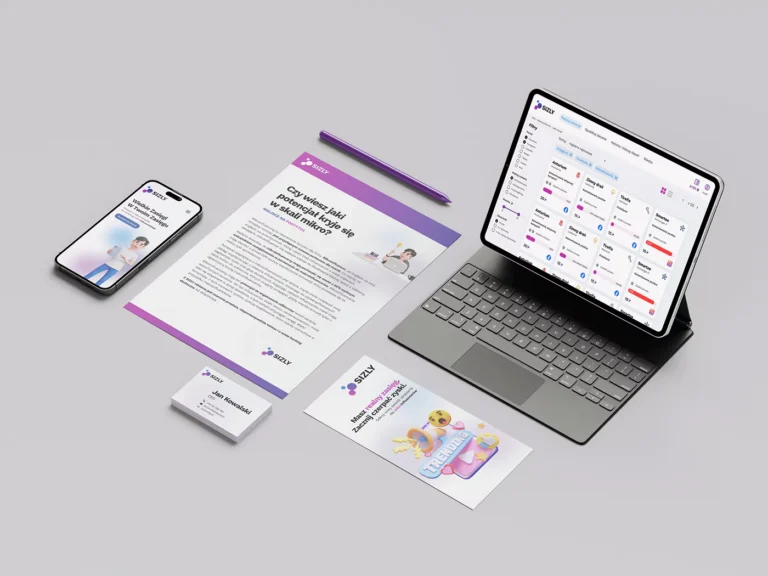
Iconographics are visual representations of information that combine icons with graphics, creating concise and understandable images that help convey complex data in a simple and attractive manner. They are used for data visualization, presenting processes, creating infographics, and in user interface (UI) design. Iconographics are ideal for quickly communicating information and enhancing understanding by combining visual elements with brief text.
How to Best Present Iconographics
To ensure iconographics are effective, they need to be well-designed and visually appealing. Key aspects include:
1. Simplicity and Clarity: The message should be simple and easy to understand. Avoid excessive text and complicated graphics.
2. Aesthetic Design: Iconographics should be visually attractive, using appropriate colors, fonts, and images that capture attention and align with the brand identity.
3. Consistency: Use a uniform graphic style for all icons and elements to ensure a cohesive look.
4. Information Hierarchy: Important information should be highlighted, with less important elements subordinated.
Designing Iconographics
Designing iconographics involves several key stages:
1. Understanding the Purpose: Understanding what information needs to be conveyed and to whom the iconographics are targeted. It’s important to grasp the goal and expectations of the audience.
2. Research and Analysis: Collecting and analyzing data that will be presented. This may include gathering statistics, facts, and other relevant information.
3. Sketching and Concept Development: Developing several concepts and sketches of the iconographics. This helps visualize how different elements will look together and how to best organize the information.
4. Choosing a Graphic Style: Selecting an appropriate graphic style that is consistent with the brand and appealing to the audience.
5. Design and Illustration: Creating the final graphics, combining icons with text and other visual elements. Using graphic design tools like Adobe Illustrator or Sketch.
6. Proofreading and Optimization: Reviewing and proofreading the design for errors and optimizing the graphic files for publication.
Finalizing a High-Quality Product
The process of finalizing iconographics involves several essential steps:
1. Proofreading and Editing: Checking all text for language and grammar errors and ensuring the message is clear and consistent.
2. Feedback and Revisions: Gathering feedback from the team, clients, or focus groups and making necessary adjustments.
3. Testing on Various Devices: Ensuring that the iconographics are readable and attractive on different devices and in various formats.
4. Technical Optimization: Adjusting file sizes, formats, and other technical parameters to ensure fast loading and optimal performance.
5. Final Approval: Obtaining final approval from all stakeholders before publishing or implementing the iconographics.
Opportunities Related to Designing Iconographics
Designing iconographics offers numerous opportunities, including:
1. Data Visualization: Presenting complex data in a simple and understandable way, which is particularly useful in reports and presentations.
2. Process Presentation: Illustrating steps and stages of processes, making them easier to understand and remember.
3. Creating Infographics: Combining iconographics with other infographic elements to create comprehensive and engaging visualizations.
4. User Interface (UI) Design: Using iconographics in applications and websites to enhance navigation and user experience.
5. Education and Training: Applying iconographics in educational and training materials to facilitate knowledge acquisition.
Where to Use Iconographics
Iconographics can be used in various contexts, such as:
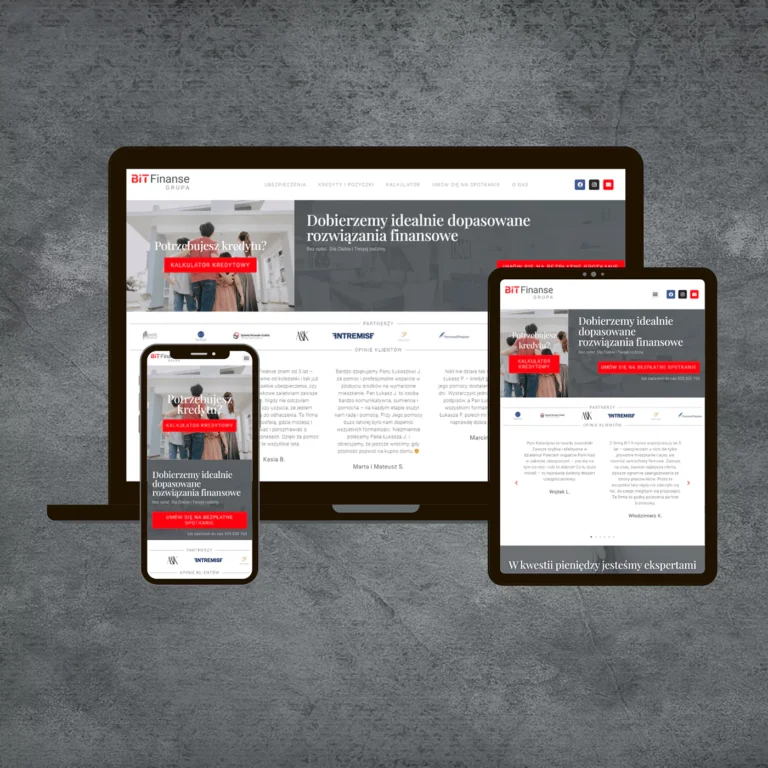
1. Websites and Blogs: Illustrating articles, blog posts, and informational pages.
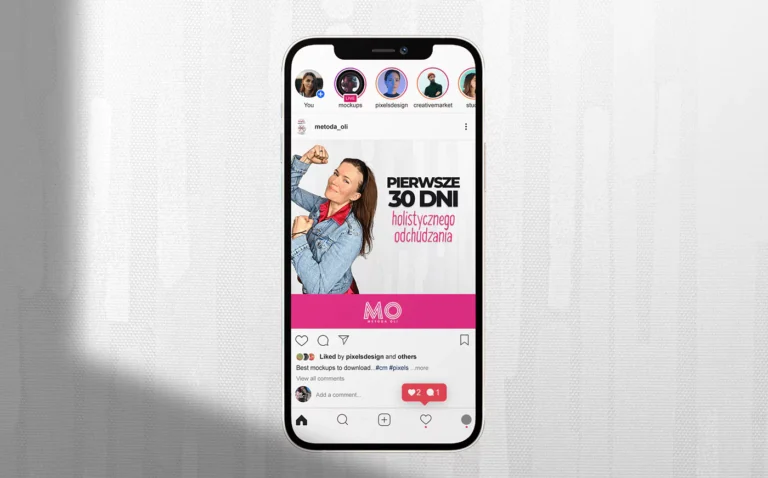
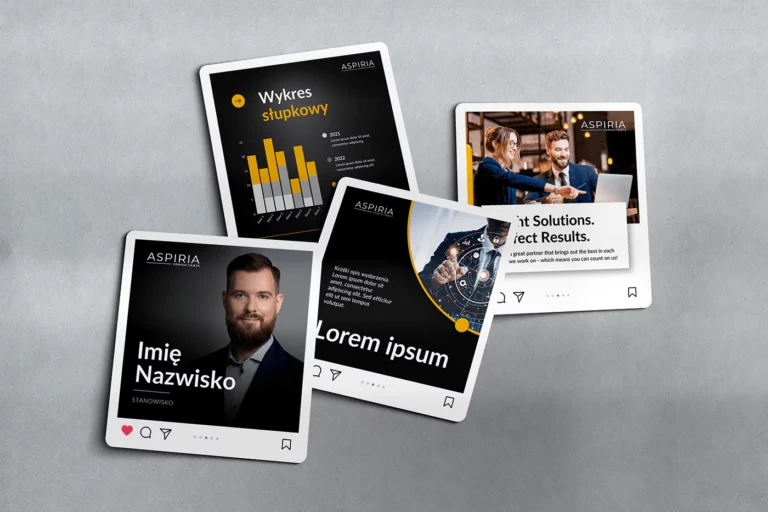
2. Social Media: Creating engaging posts and infographics for sharing on social media platforms.
3. Presentations and Reports: Using iconographics in business presentations, reports, and corporate documents.
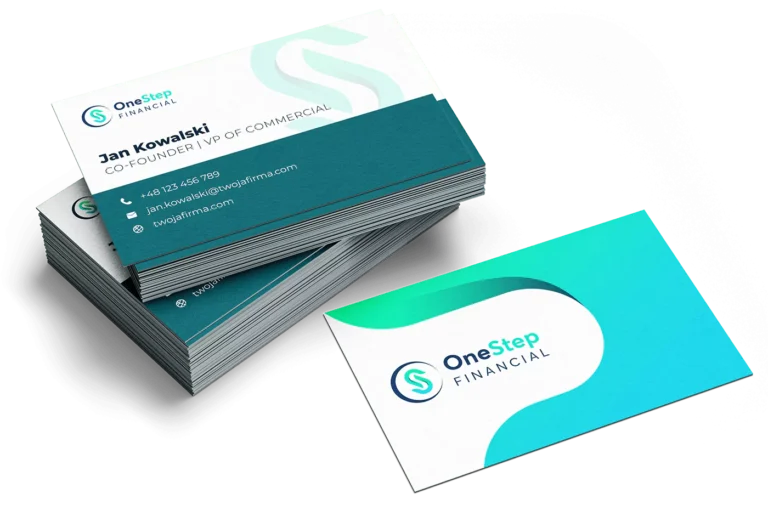
4. Marketing Materials: Applying iconographics in brochures, flyers, and other promotional materials.
5. Mobile Apps and Websites: Using iconographics to improve user interface and ease navigation.
Conclusion
Iconographics are powerful tools for visualizing information and conveying complex data in an accessible way. Focusing on simplicity, aesthetics, consistency, and information hierarchy can significantly enhance their effectiveness. Designing iconographics offers broad application opportunities, from data visualization to user interface design, and can be used in various contexts to engage audiences and facilitate information absorption.


